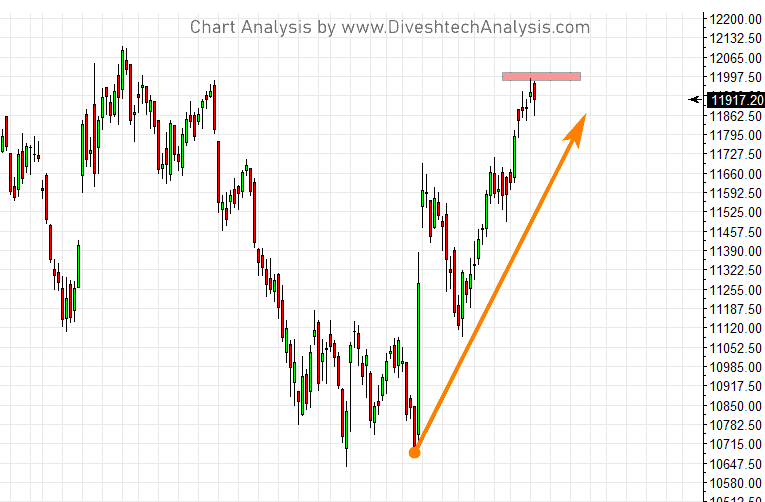
In the last Nifty Analysis, we discussed. We should carefully watch Price action in the 11973-12005 Gann resistance zone for a further clue about the market trend. On the lower side, Support is now shifted at 11840 below that we may see a dip towards 11800/11720 levels.
Yesterday Nifty Index opened the gap up. It made the high around 11979, which is in the Gann resistance zone.
From the day high, Nifty again corrected almost 140 points and rewarded well.

The above 5 min Nifty Intraday chart shows where our new and one of the best trading technique ‘Hook Timing Method’ gave the turns for Intraday trading.
The swing trading plan is still the same Nifty bulls need the close above 11973-12005 range, and bears will get further below 11840.
Intraday Nifty Analysis / Trading Levels for 06th Nov
Resistance for today in Intraday is at 11940 above the move towards 11975/12025/12110 can seen.
While Support for today is likely to come at, 11880 below that move towards 11845/11795/11710 can be seen.
Note: Above mention Price projection & other Information are for educational purpose only.