Last week, below 11790, Nifty did our 2nd weekly target on the downside. In the previous week, the low of the week came on 19th June, the Time Cycle date that we discussed in our analysis.
From there, Nifty showed a rise of almost 2225 points to 11800 levels.
Nifty ended with a loss of 99.20 points weekly.
Geopolitical tension between the US and Iran will be the market’s key driving factor.
On the Nifty hourly chart, Bulls need to trade above 11800 for a further rise towards 11850/11925 levels.
Nifty Bears will get the chance only below 11700 Support for the move towards 11650/11570 levels.
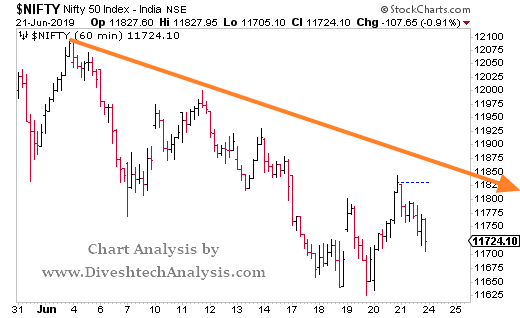
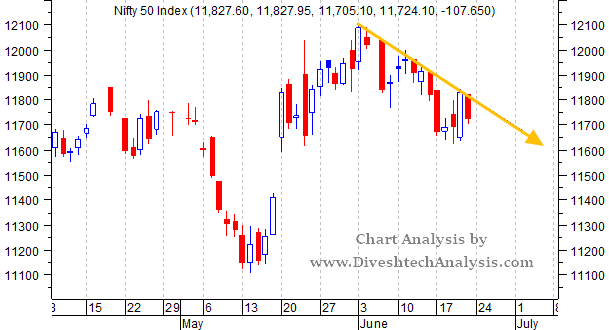
In the Nifty Daily Chart, prices are getting resistance at the angle shown above.
Bulls need to trade successfully above the angle for a further rise towards 11790/11910 levels.
Any close below 11695 will add a bit of recent weakness to the Nifty Index, causing a fall of 70-120 points.
Nifty Weekly Analysis For the Week 24-28 June
In the forthcoming week, 26 & 28 June are the critical dates.
Next week, 11850 will act as Resistance above, which moves towards 11915/11990/12110 can come.
While Support is likely to come at 11695 below that move towards 11630/11555/11430 can come.
Note: The above-mentioned price projection & other Information are for educational purposes only.