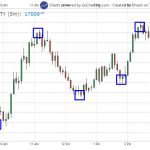
In continuation with our Stock Maruti Intraday analysis. Yesterday, we saw there was a rise of nearly 1% from our predicted pivot/resistance level. Now, let’s see what stock did today as per our unique trading technique.
In the above chart, if we see the yellow dot area was our revised Stop / Trend change level for today & today, it made low precisely on that point only. And today further, there was one more buying opportunity for intraday trade, which was marked as a red dot area above the yellow dot area.
It is a fundamental rule one should not do what ordinary traders do. These are specific laws of nature, which exist in our trading, about that ordinary traders are not aware.
That establishes us in an excellent place as confident traders. To find unique and useful entry and exit points to the market, you can join one of our courses. Which are time-tested & have taken more than a decade to come into the light.


